
第149章 快速粗粒度 CPU 性能分析(Flamechart)
如何借助内部工具进行性能分析,让 Zed 始终保持流畅。
观察 CPU 耗时最多的环节。强烈推荐大家使用 samply。它会在浏览器中打开一个交互式性能分析文件(具体来说,是 firefox_profiler 的本地实例)。
请查阅 samply 的 README 了解如何安装和运行。
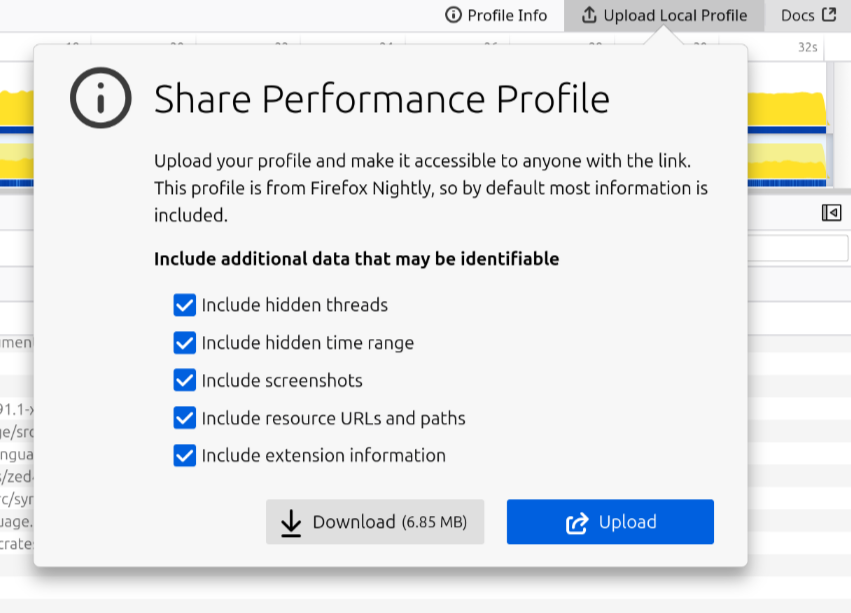
profile.json 文件本身不包含任何符号信息。Firefox profiler 可以为该文件补充本地符号。操作方法:点击右上角的"上传本地 profile"按钮。
深度 CPU 性能分析(Tracing)
查看每个经过标注的函数调用耗时以及其参数(如果已配置)。
对任何希望出现在性能分析结果中的函数,都加上 instrument 标注。更多细节请参见 tracing-instrument 文档:
#[instrument(skip_all)]
fn should_appear_in_profile(kitty: Cat) {
    sleep(QUITE_LONG)
}
然后使用 ZTRACING=1 cargo r --features tracy --release 编译 Zed。release 构建虽是可选的,但强烈建议启用,因为就像其他程序一样,Zed 在优化编译下的性能特征会发生显著变化。你不该去排查那些在 release 模式下并不存在的性能瓶颈。
一次性设置/构建 Profiler:
下载 Profiler: Linux x86_64 macOS aarch64
替代方案:自行构建
- 克隆仓库:git@github.com:wolfpld/tracy.git
cd profiler && mkdir build && cd build- 运行 cmake 生成构建文件:
cmake -G Ninja -DCMAKE_BUILD_TYPE=Release .. - 构建 Profiler:
ninja - (可选)将 Profiler 移动到 ~/.local/bin 等便于访问的路径(Linux 系统)
使用
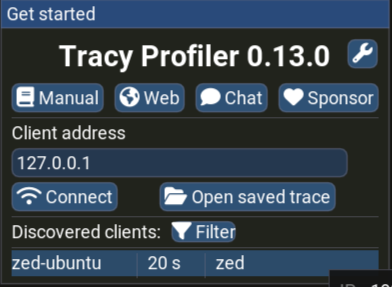
打开 Profiler(tracy-profiler),你应当在 Discovered clients 列表中看到 zed,点击它即可。
Tracy 是一款非常强大的性能分析工具,功能很多,但 UI 不太友好。这里不打算写 Tracy 的深入教程,只想介绍一个特别实用的工作流——当你想知道某段代码为什么偶尔变慢时,它能派上用场。
步骤如下:
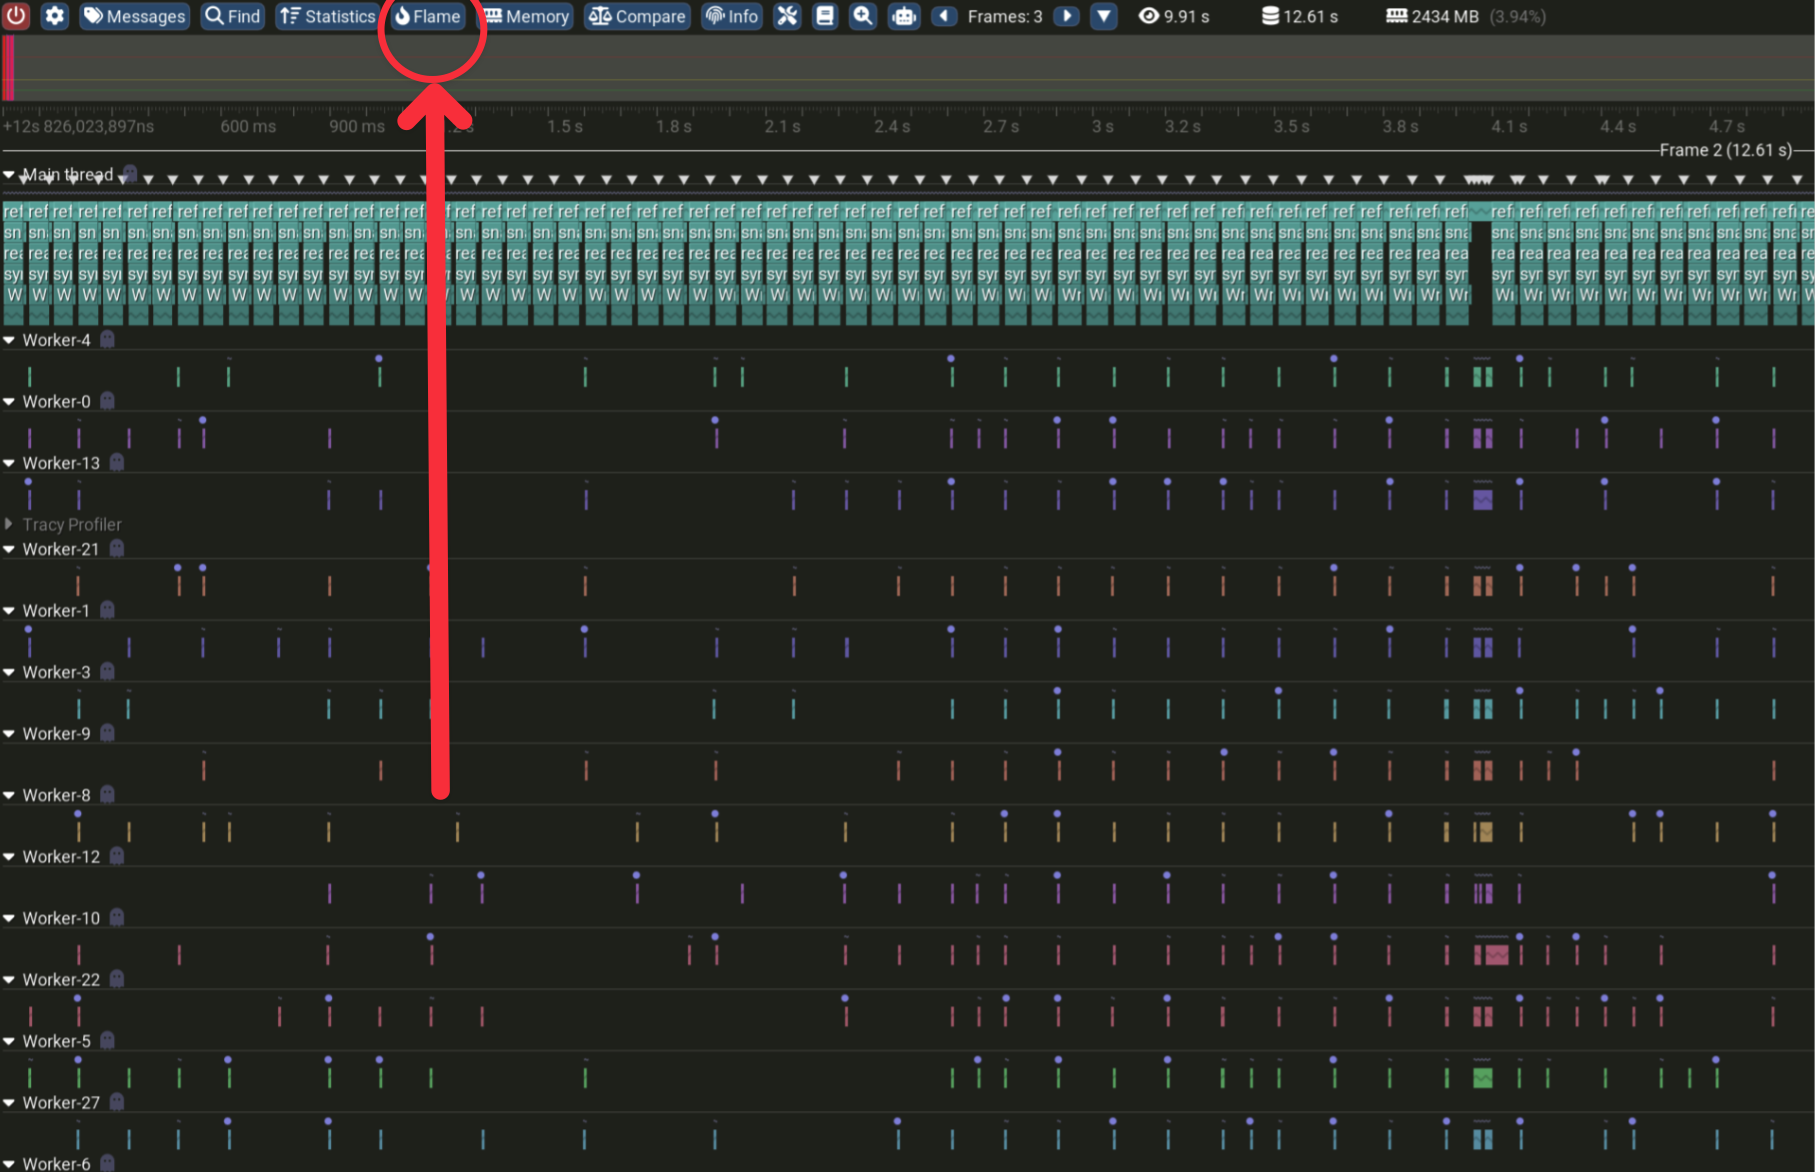
- 点击顶部的 flamechart 按钮。
- 点击一个耗时较长的函数。
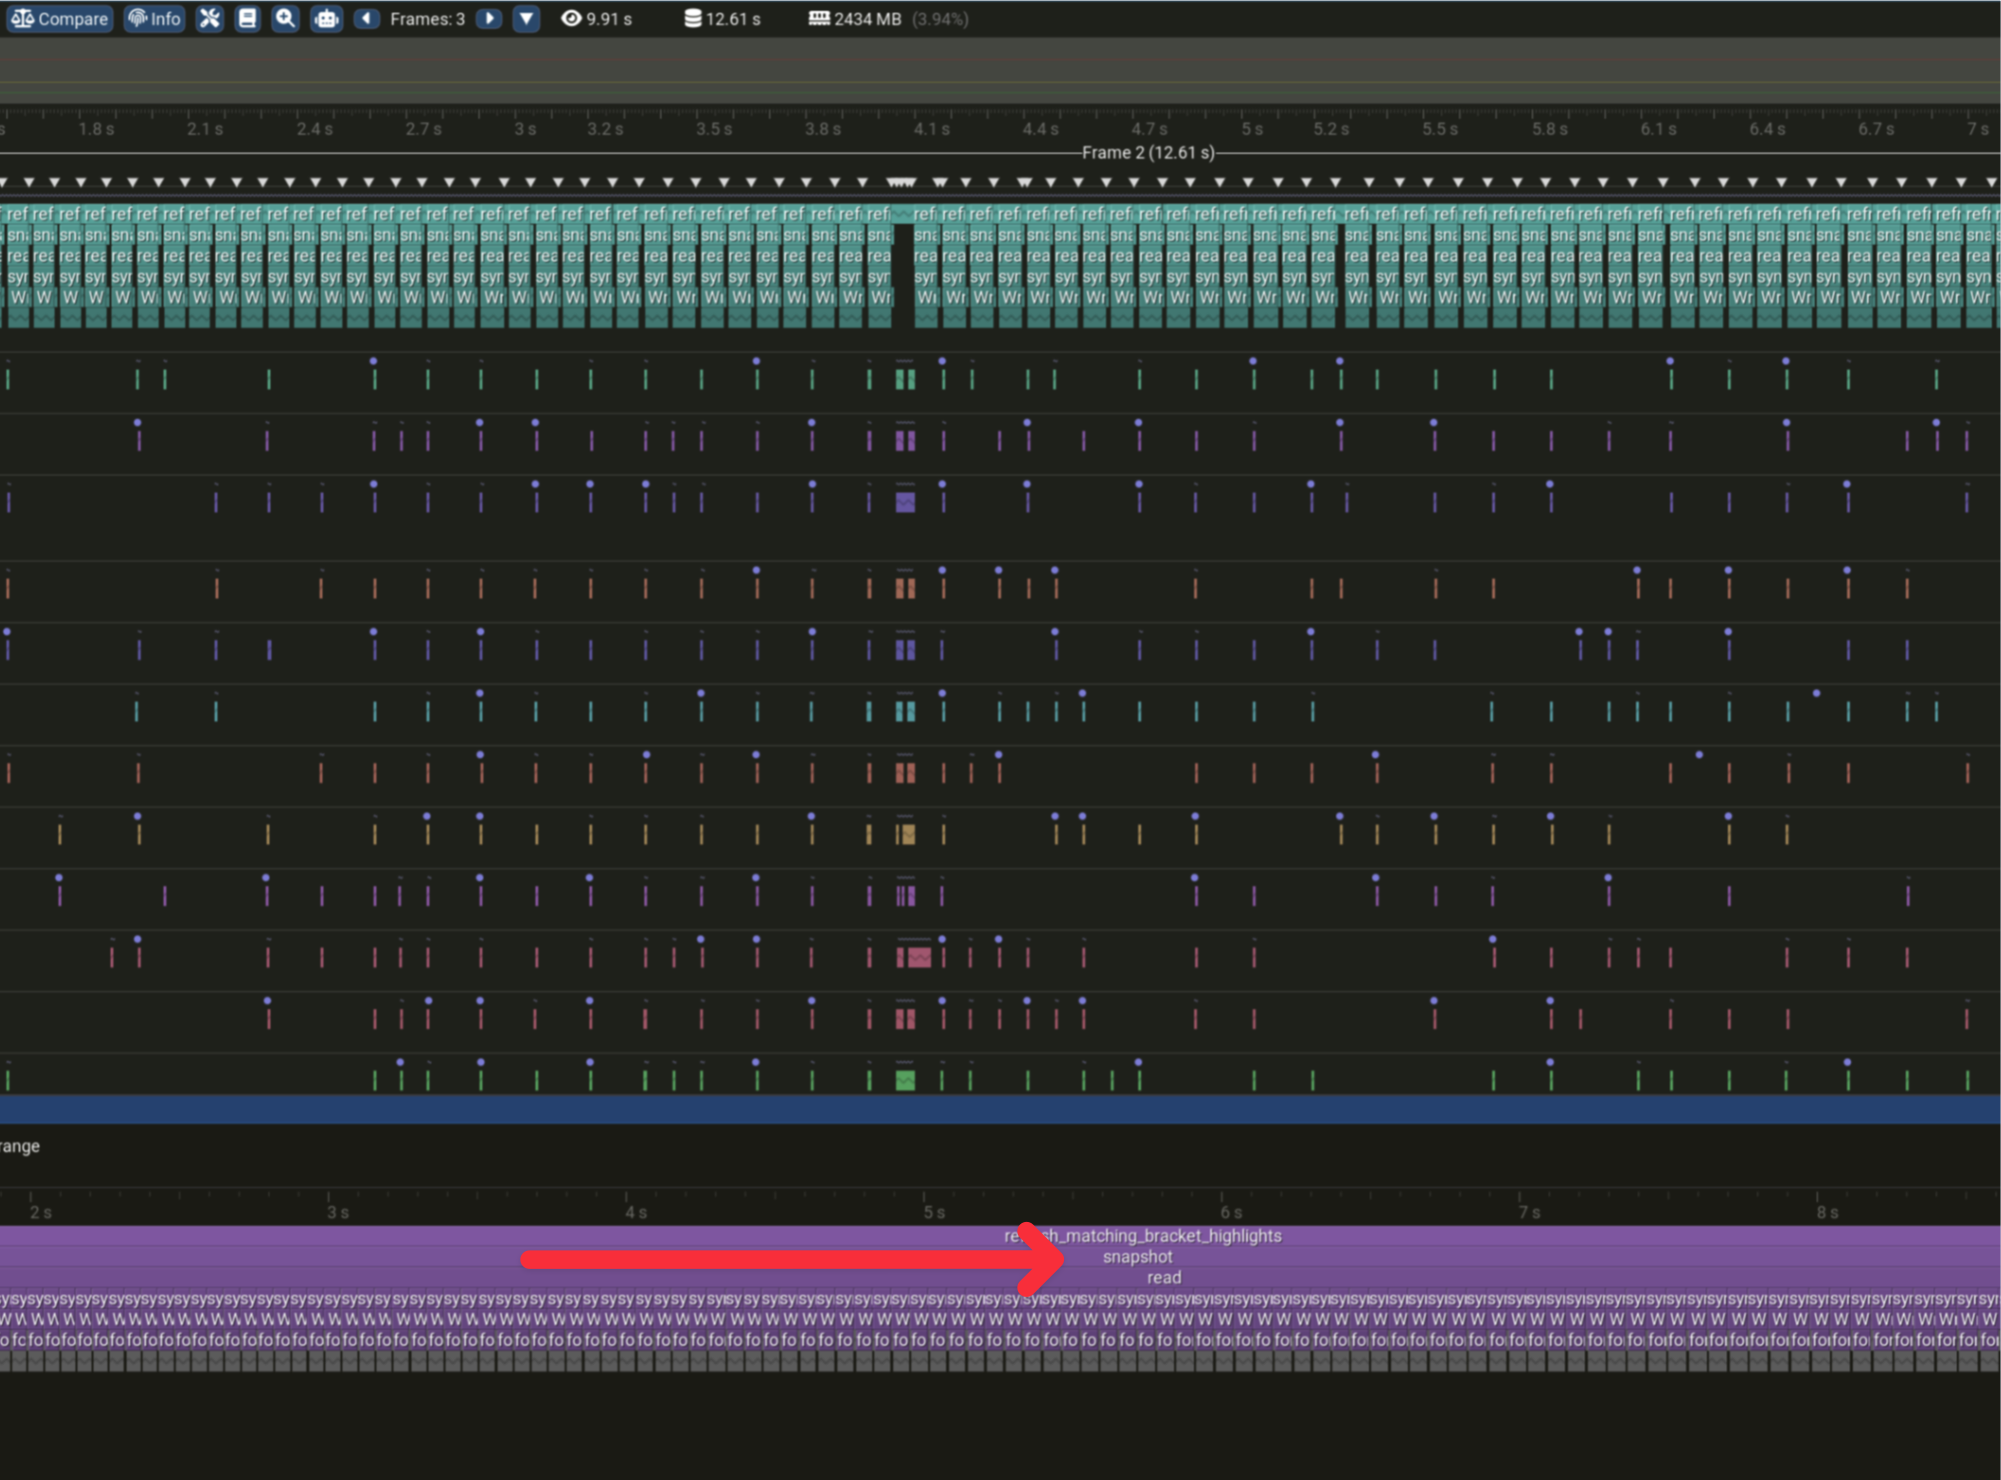
- 点击 main thread,展开函数调用列表。
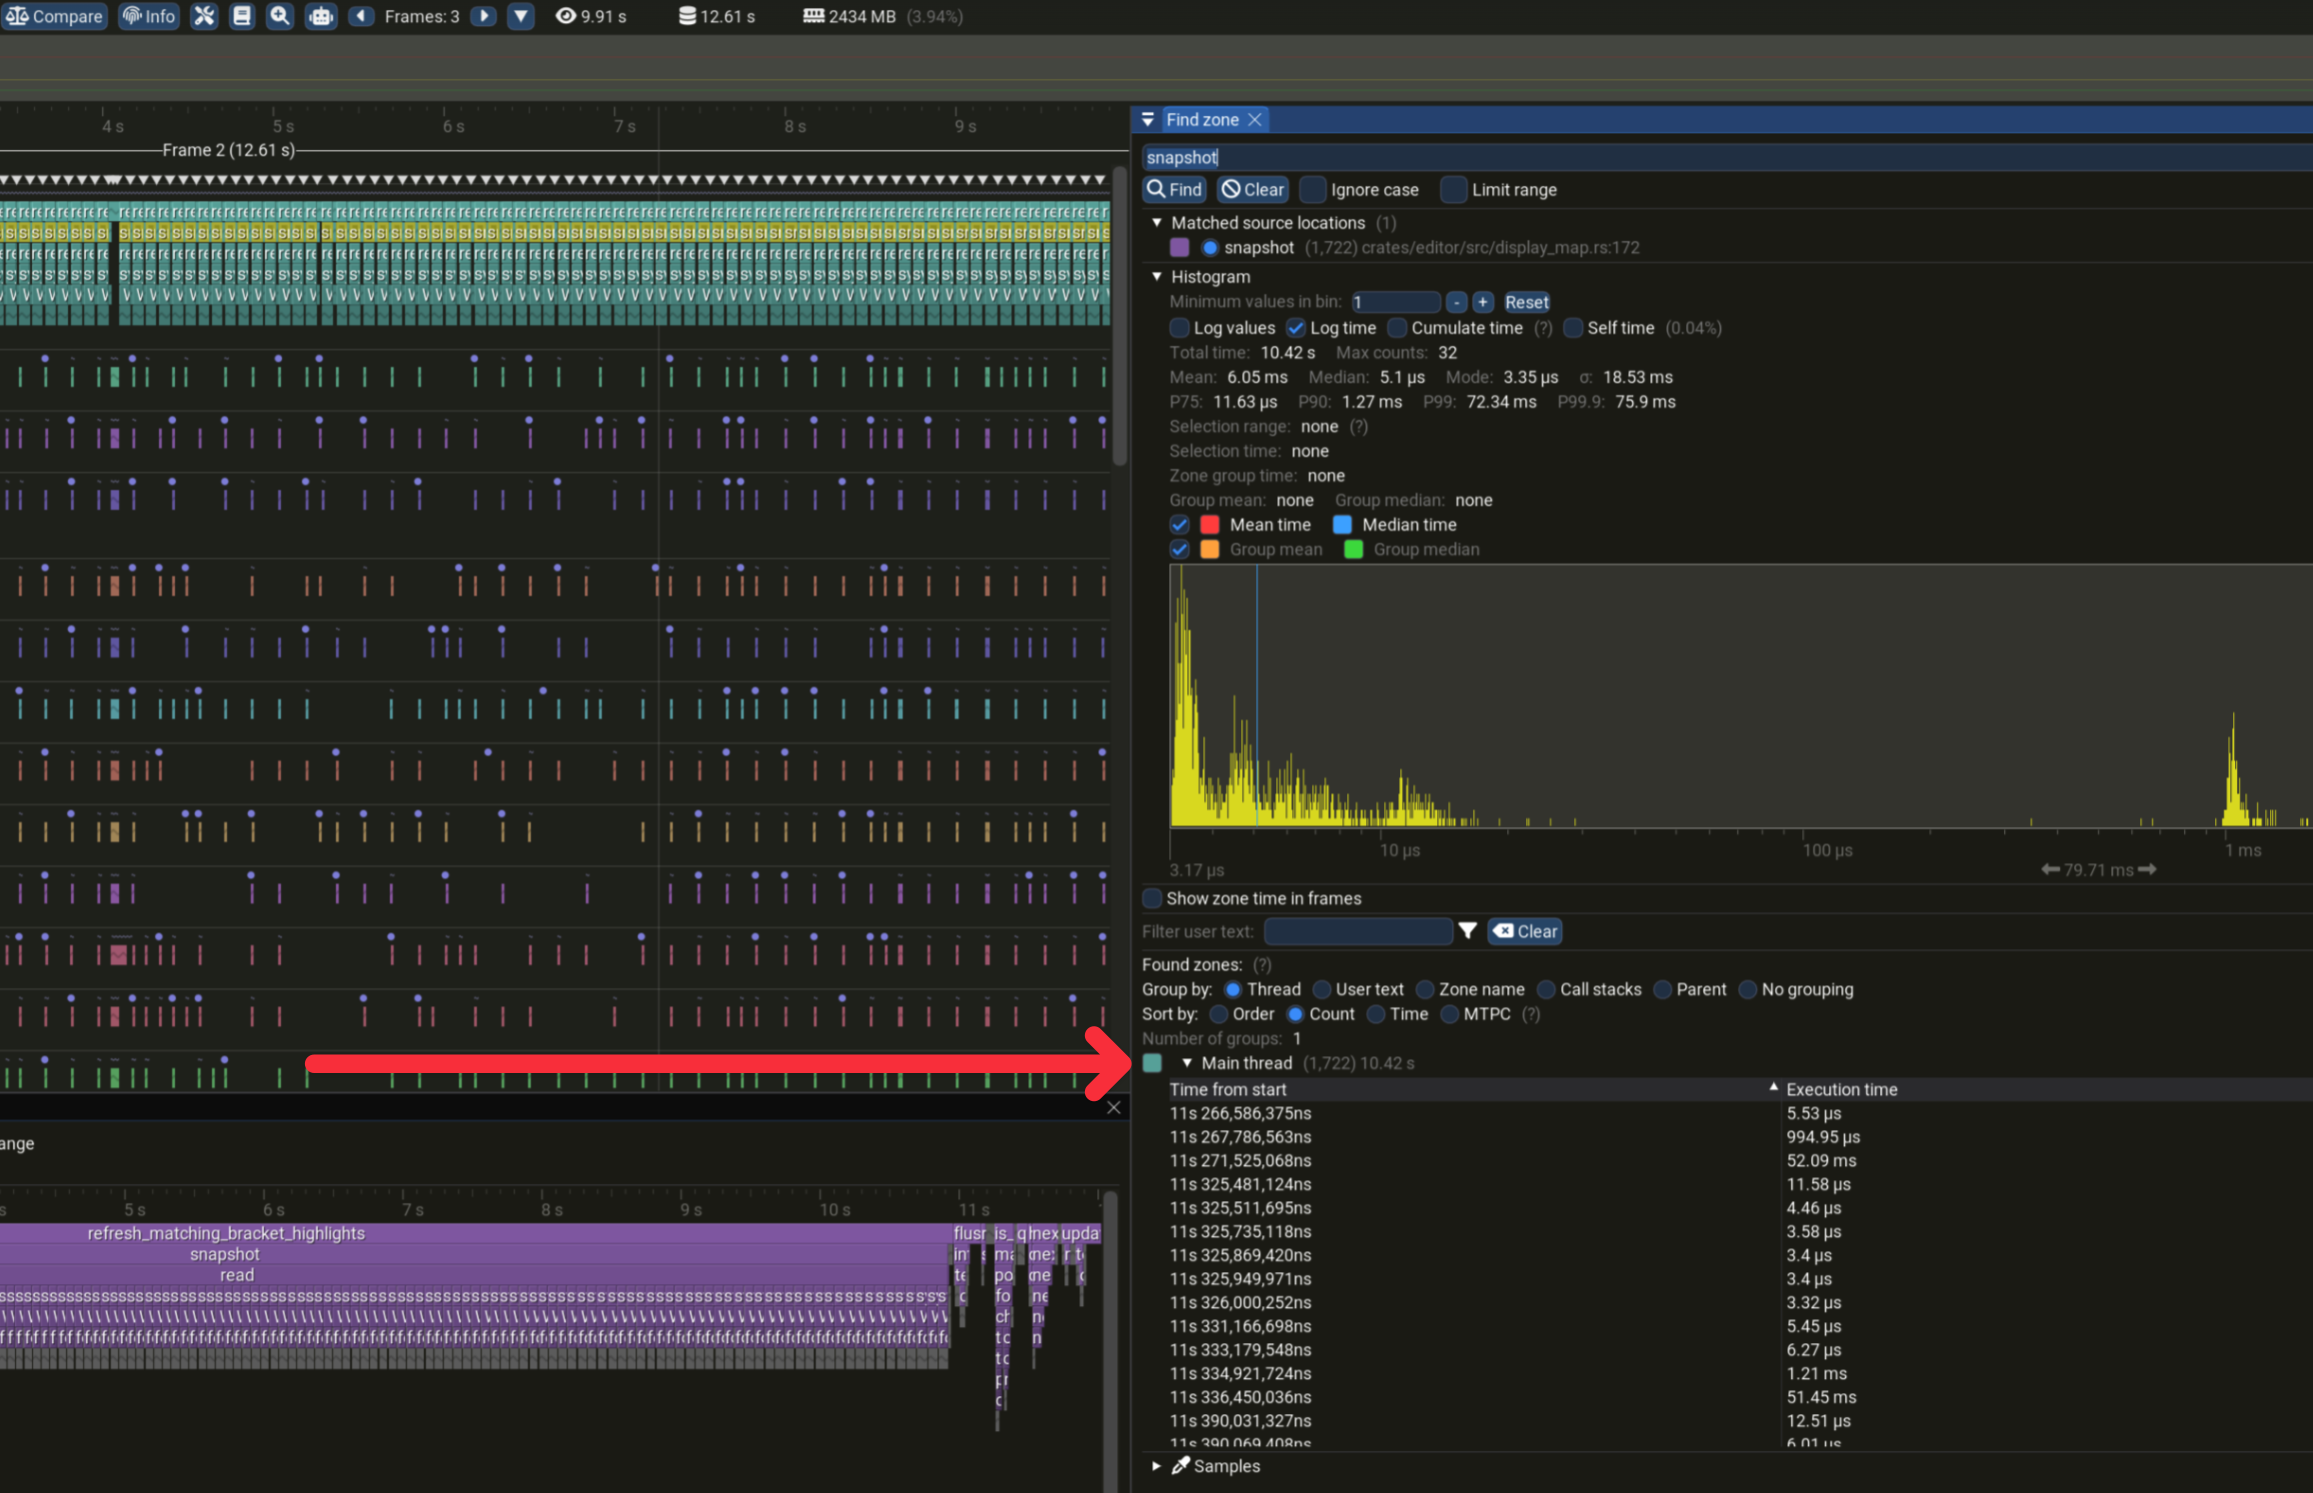
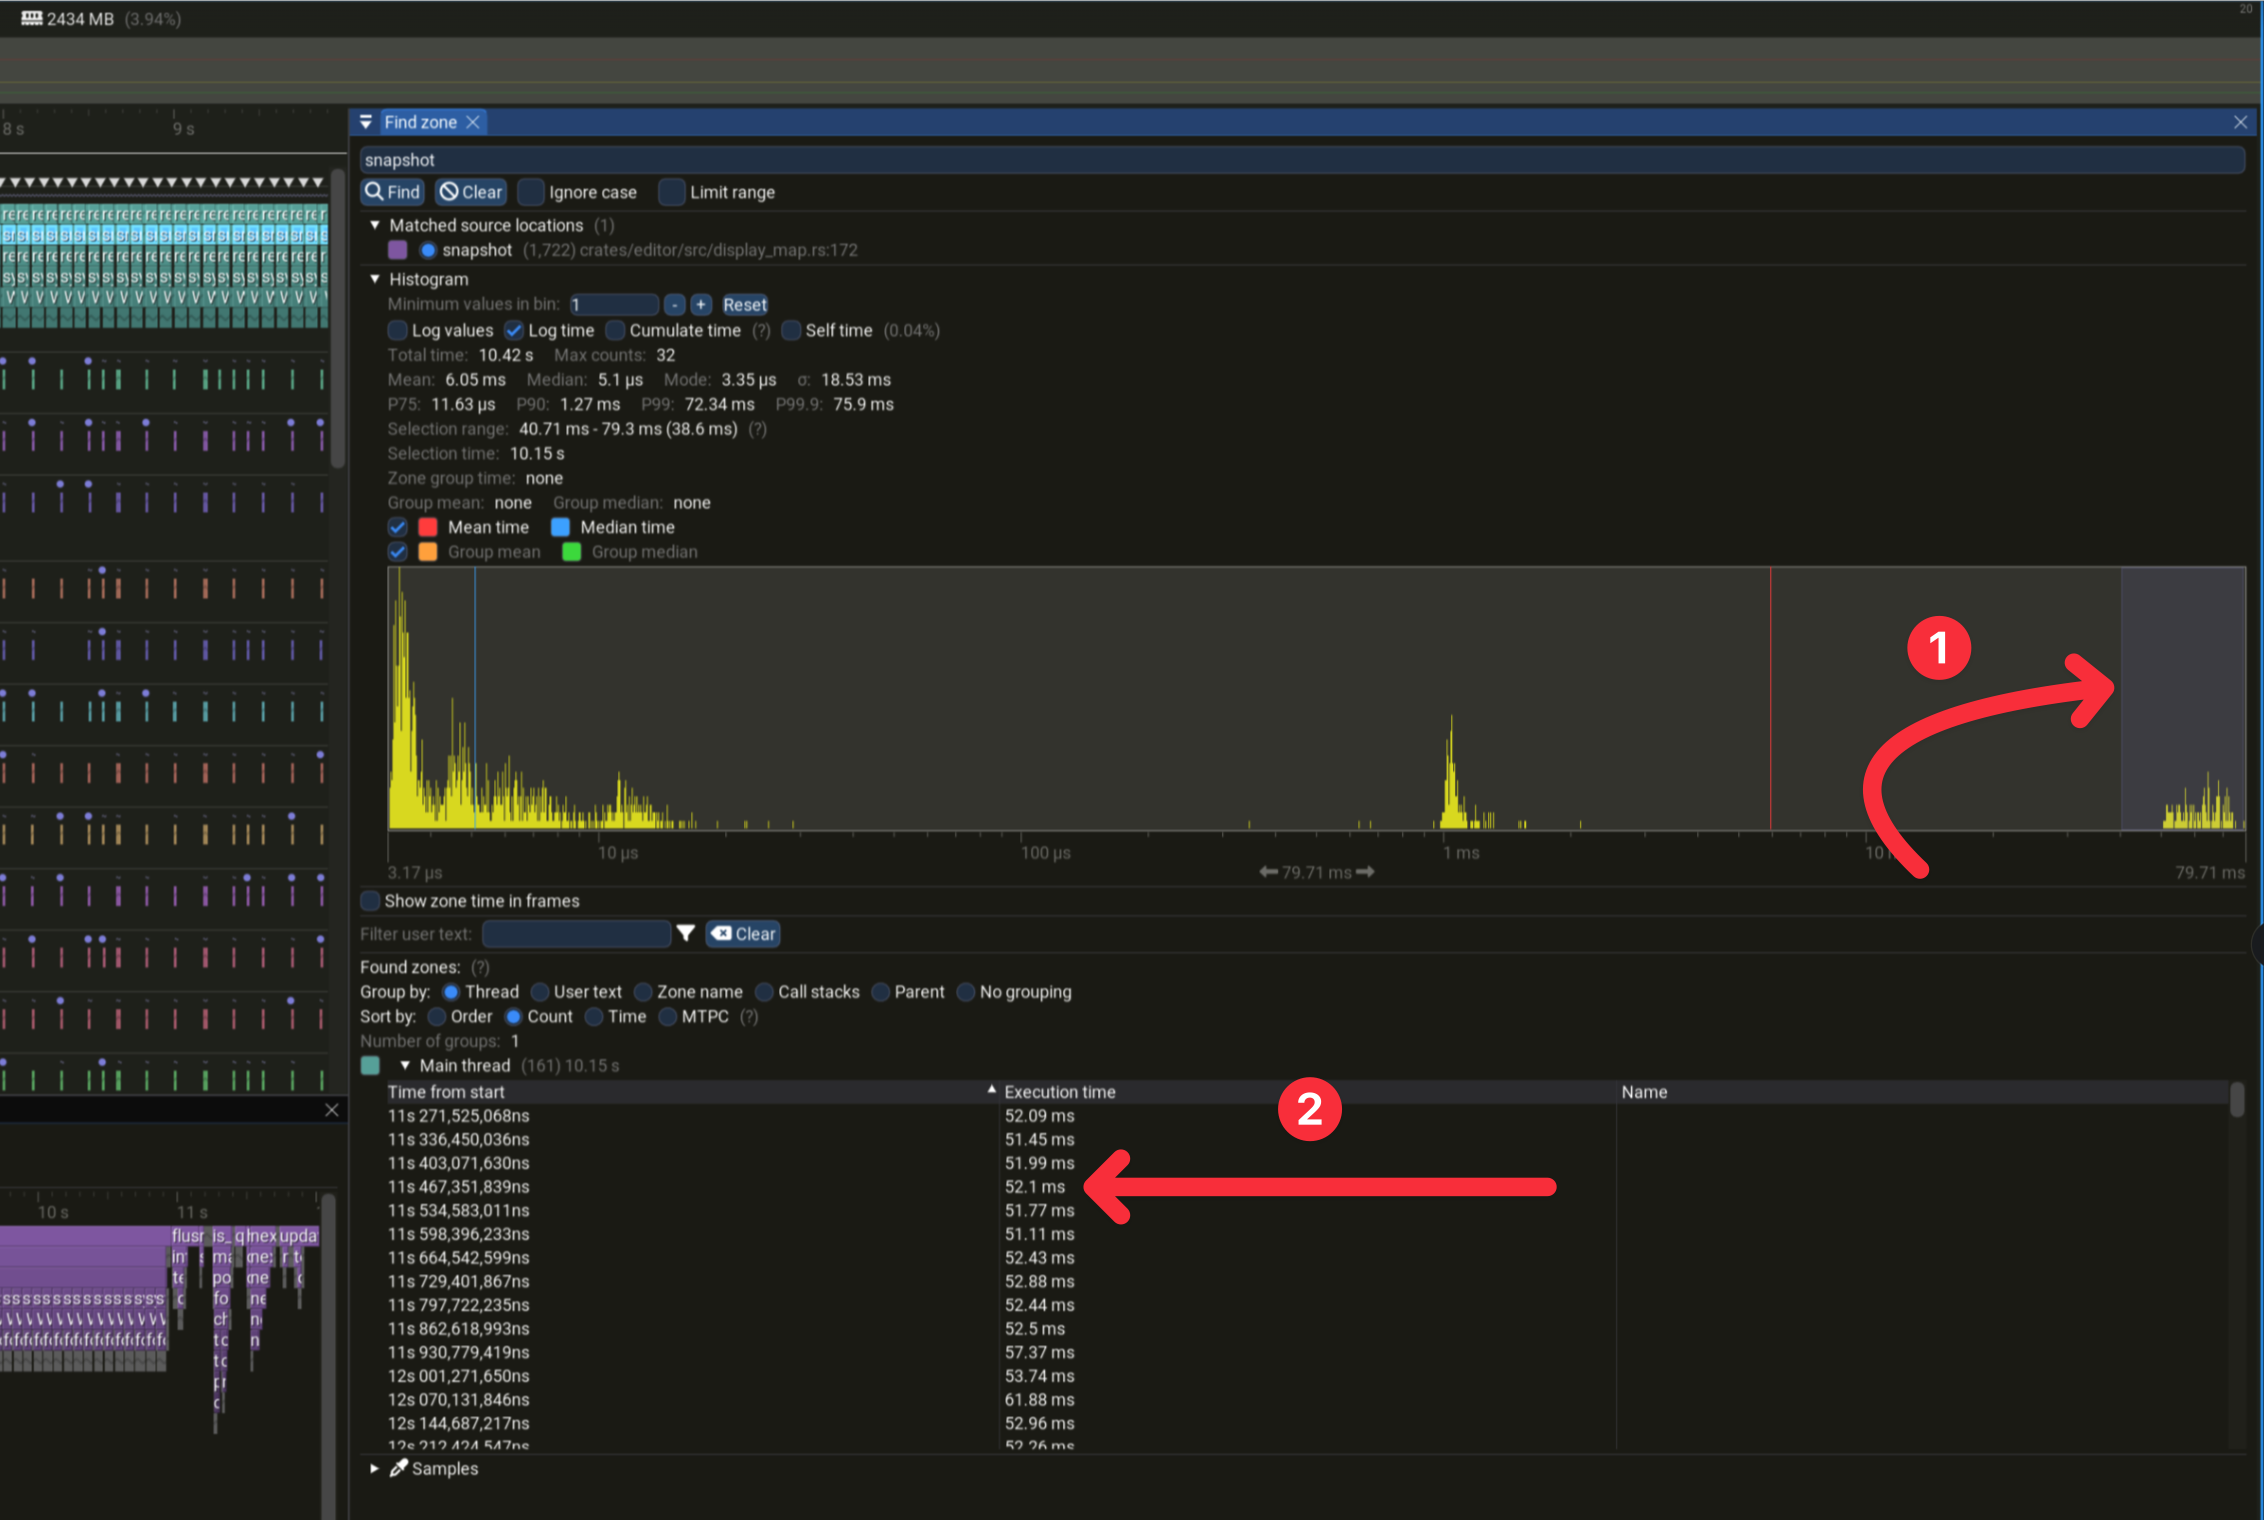
- 用过滤器筛出较慢的调用,然后点击列表中的某条慢调用。
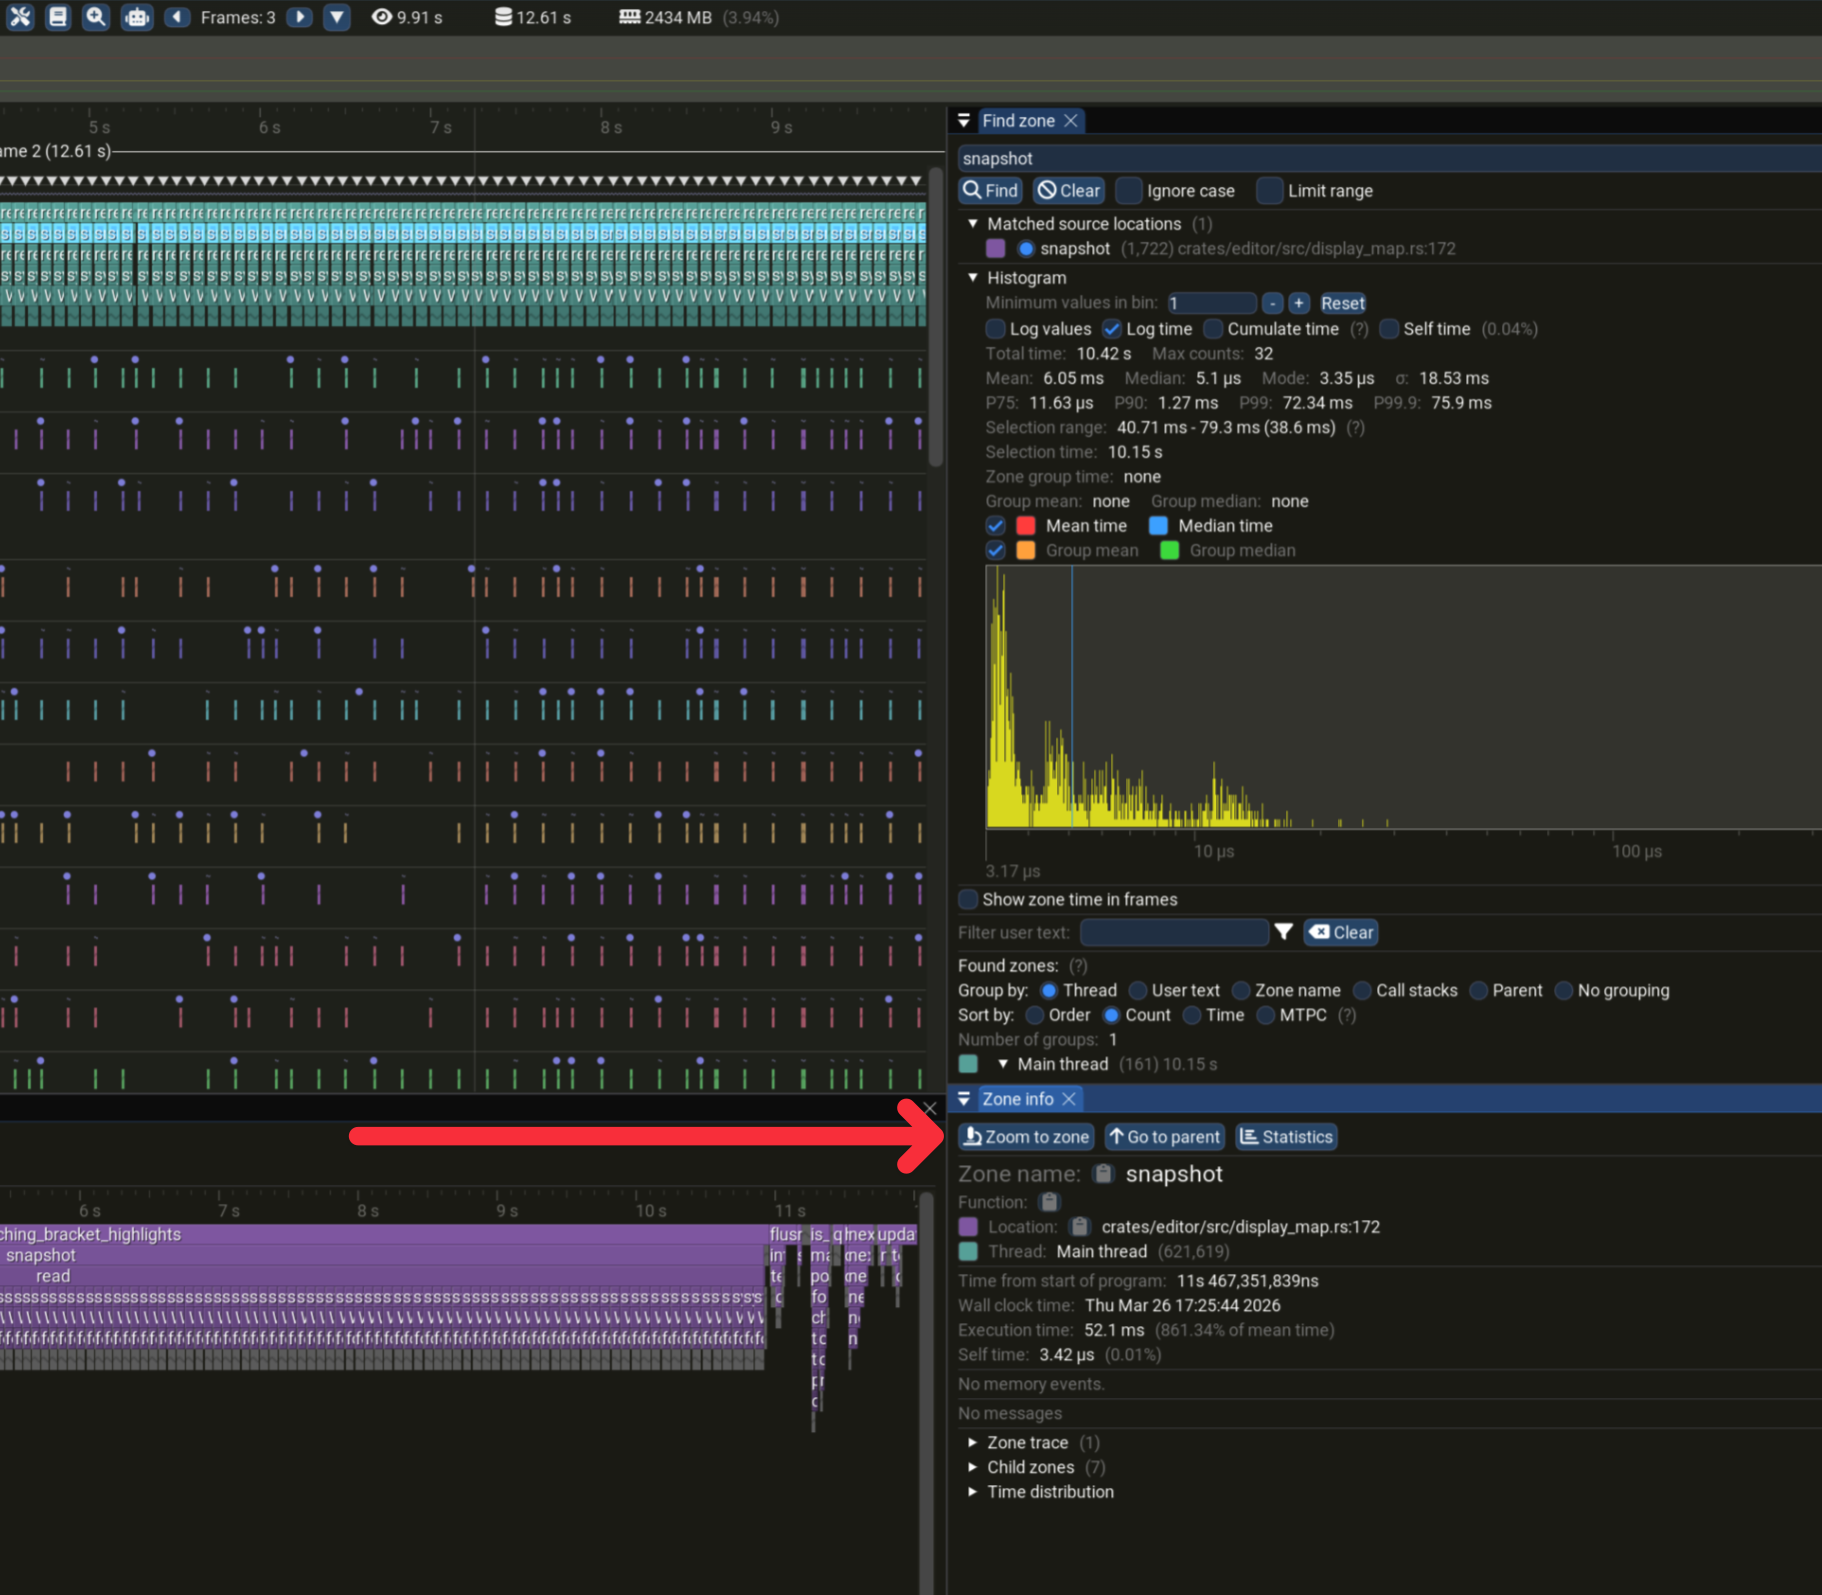
- 点击 zoom to zone,跳转到时间线中该次具体的函数调用。
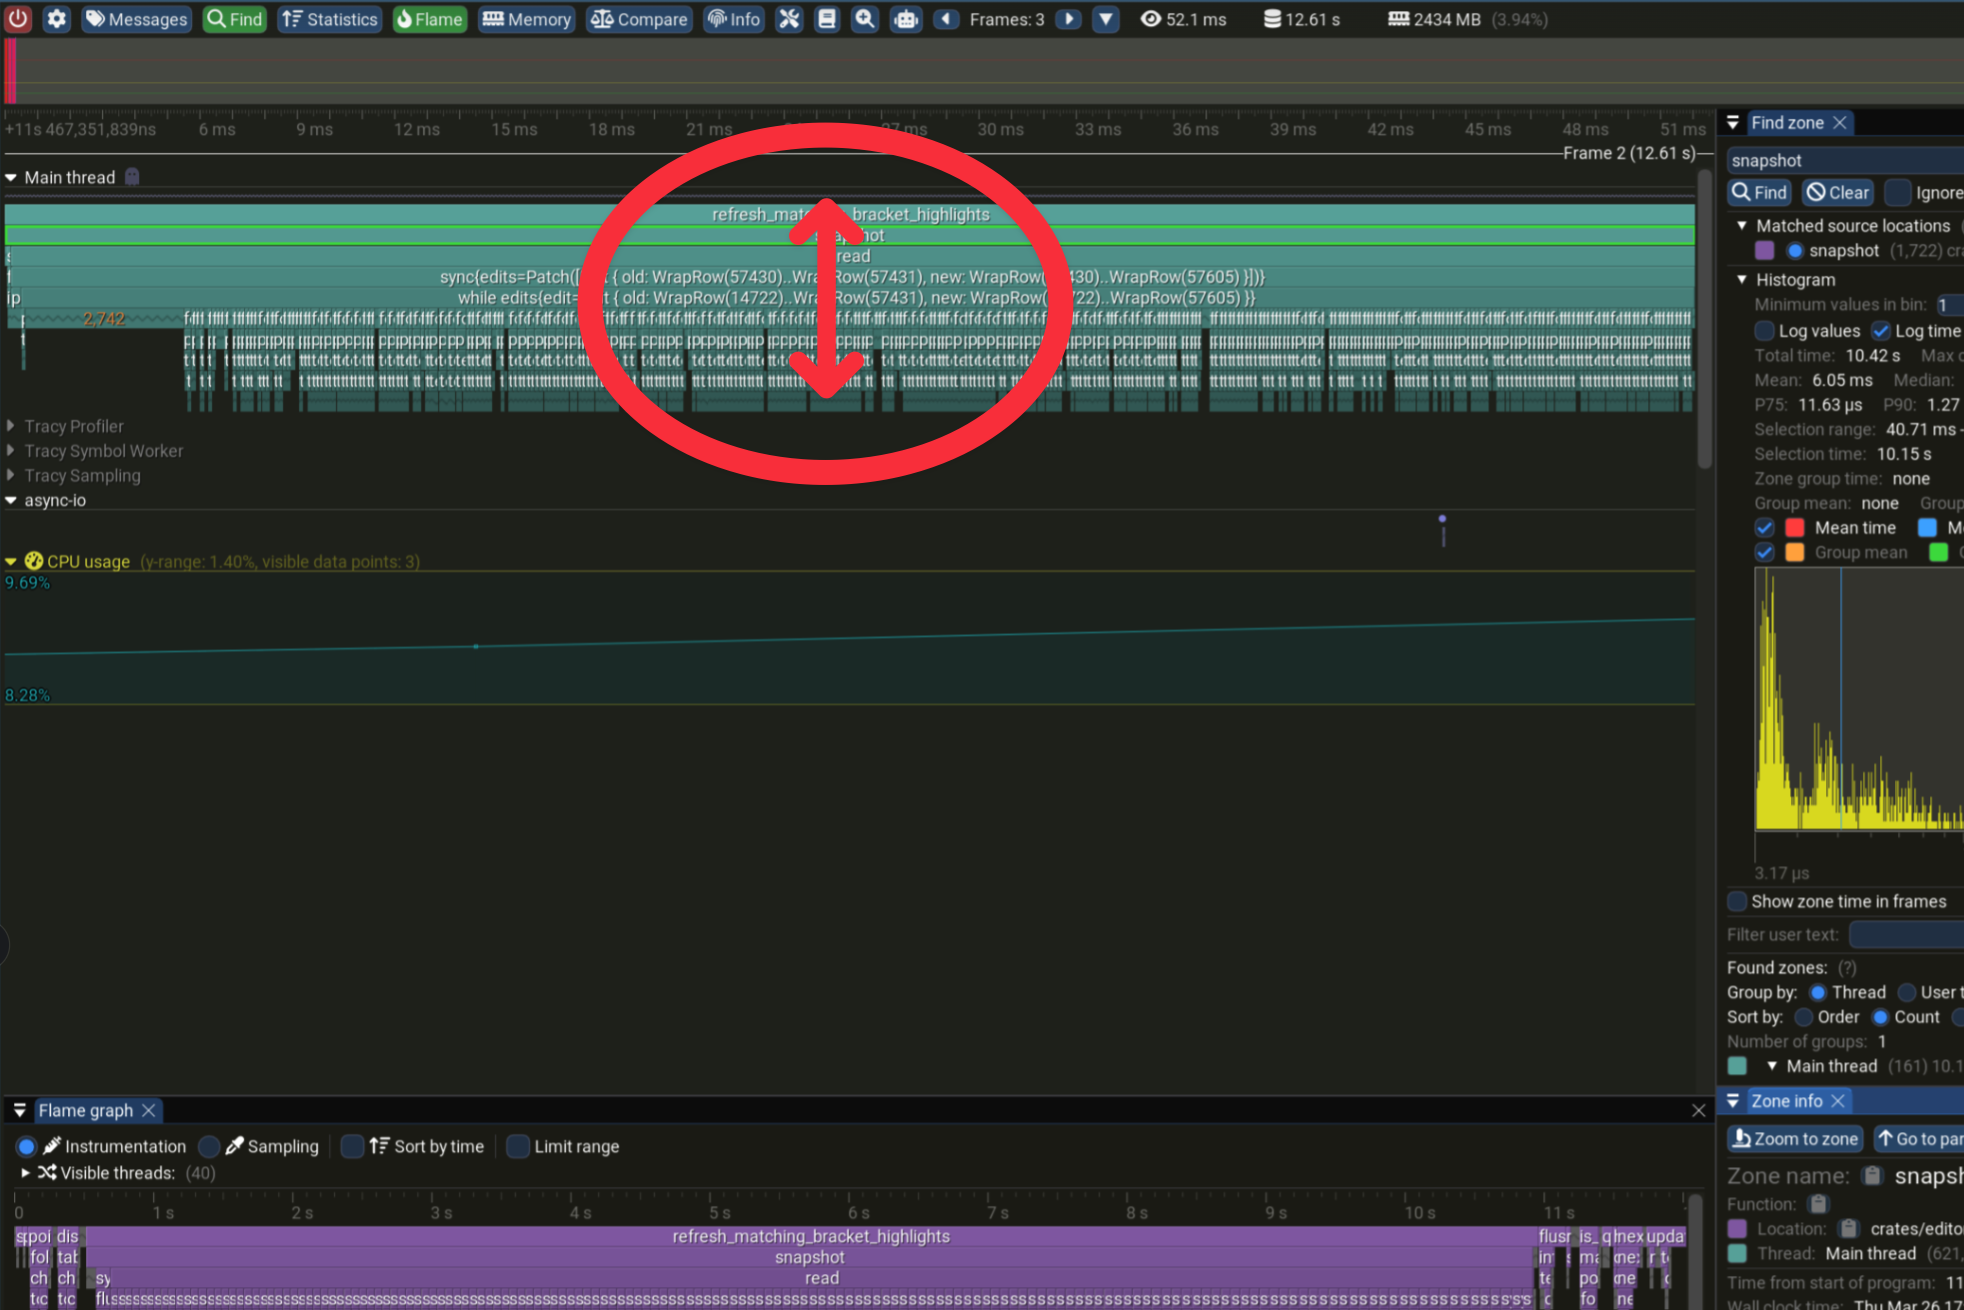
- 滚动缩放,查看调用方的更多细节。
- 点击某个调用方,查看它的统计信息。
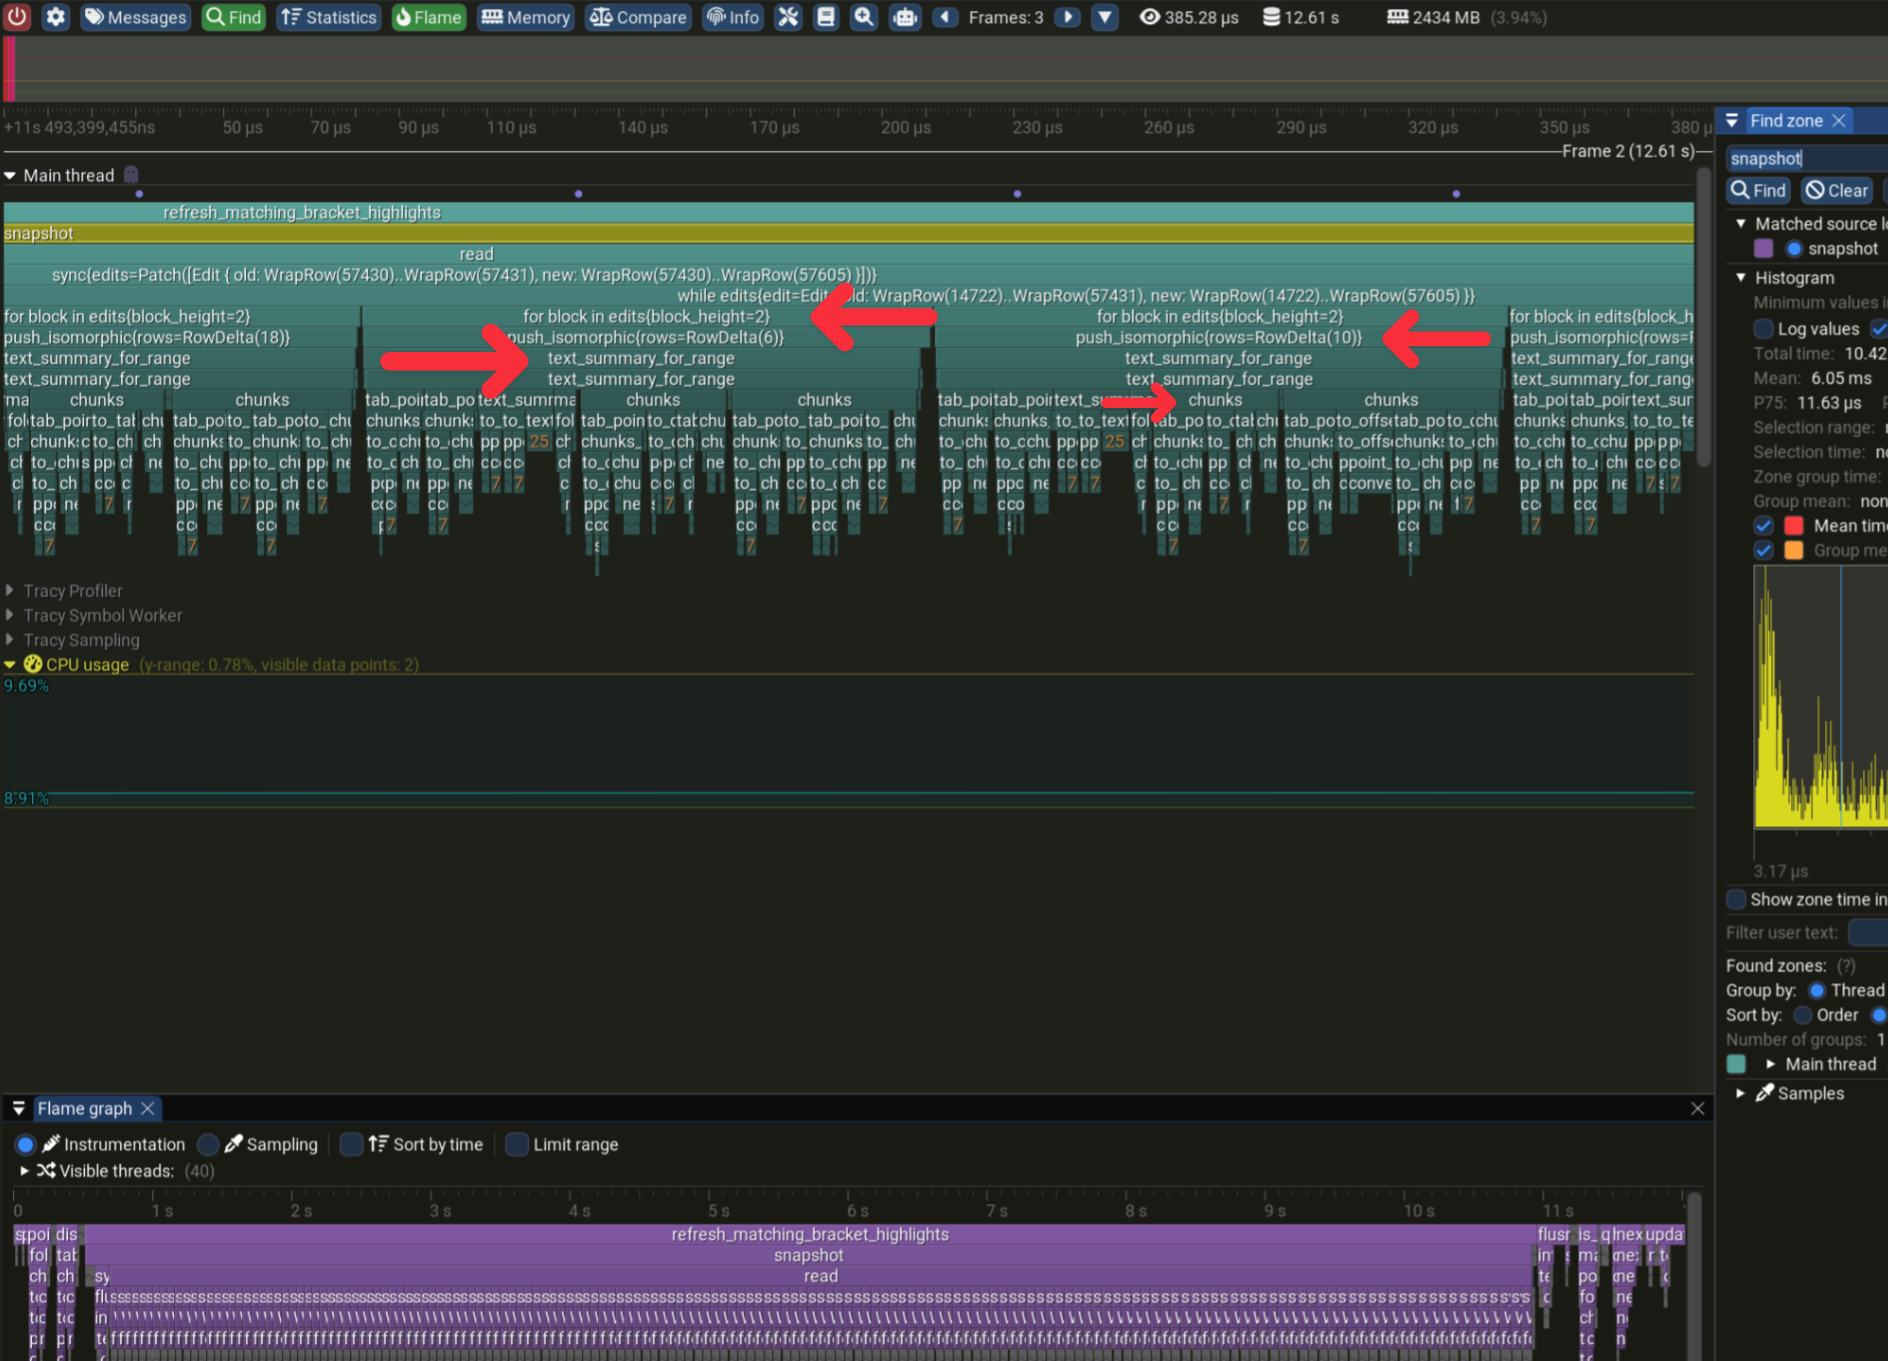
Tracy 时间轴中的蓝色条通常对应函数调用,但也可以对代码库中的任意部分进行计时。下面的示例中,我们为 “for block in edits” 添加了一个额外的 span,并为其附加了元数据:block_height。写法如下:
let span = ztracing::debug_span!("for block in edits", block_height = block.height());
let _enter = span.enter(); // span guard, when this is dropped the span ends (and its duration is recorded)
任务/异步分析
获取 Zed 前台执行器和后台执行器的性能分析数据。检查是否有代码阻塞前台时间过长,或后台占用过多(时钟)时间。
分析器始终在后台运行。你可以从其 UI 中保存 trace,或者实时查看结果。
设置/构建导入器:
下载导入器 linux x86_64 mac aarch64
替代方案:自行构建
- 克隆 git@github.com:zed-industries/tracy.git 仓库,切换到 v0.12.2 分支
cd import && mkdir build && cd build- 运行 cmake 生成构建文件:
cmake -G Ninja -DCMAKE_BUILD_TYPE=Release .. - 构建导入器:
ninja - 对 trace 文件运行导入器:
./tracy-import-miniprofiler /path/to/trace.miniprof.json /path/to/output.tracy - 在 Tracy 中打开该 trace:
- 如果你使用 Windows,请从上游仓库的发布页下载 v0.12.2 版本
- 如果你使用其他平台,可在网站 https://tracy.nereid.pl/ 上打开(版本可能不匹配,结果取决于运气,理想情况下我们最好自己托管)
保存 Trace:
- 运行命令:
zed open performance profiler - 点击保存按钮。这会弹出保存对话框;如果对话框无法打开,trace 将保存在你的工作目录中。
- 使用导入器将性能分析文件转换为可导入 Tracy 的格式:
./tracy-import-miniprofiler <path to performance_profile.miniprof.json> output.tracy
函数耗时过长时发出警告
let _timer = zlog::time!("my_function_name").warn_if_gt(std::time::Duration::from_millis(100));