使用 OpenTelemetry 实现 E2B 沙箱监控与追踪
E2B 在隔离的 Linux microVM 中运行 AI 生成的代码。你的 Agent 创建一个沙箱,在其中执行代码,读取输出,然后销毁沙箱。这个循环中容易出现两类问题,且每一类都需要独立的遥测手段:一是沙箱内部的代码失败或挂起;二是沙箱生命周期本身变得缓慢或报错。沙箱是临时性的,失败执行会在你打开终端之前就消失了,且没有工具记录其退出原因,除非你预先进行插桩。本页涵盖这两部分内容。完成后,你将获得:失败执行及其原因、E2B 本身导致的请求延迟占比(相对于你自己的代码),以及按秒计费时那些存活时间足够长从而影响账单的沙箱列表。
使用自托管的 SigNoz?大多数步骤是相同的。请参考从云端到自托管的文档更新端点并移除摄取密钥头。
前置条件
- 一个 SigNoz 实例(云端或自托管版本均可)
- Python 3.10 或更高版本。
e2bSDK 需要 3.10。 - 一个来自E2B Dashboard的 API 密钥。除最后一种路径外,本页的所有路径都适用于免费的 Hobby 计划。
工作原理
E2B 通过五条路径产生遥测数据。这些路径互不重叠,请根据你的需求选择合适的。
| 路径 | 你能获得什么 | 你需要付出什么 |
|---|---|---|
| 对创建沙箱的应用进行插桩 | 每个会话一个 trace,每次执行一个 span,退出码和错误 | 对 Sandbox.create、run_code 和 commands.run 的包装器 |
| 对沙箱内运行的代码进行插桩 | 生成代码的 span 和日志,关联到同一个 trace | 将 OpenTelemetry SDK 注入沙箱 |
| 沙箱资源指标 | 每个沙箱的 CPU、内存和磁盘 | 对 get_metrics() 的轮询器 |
| 沙箱生命周期事件 | 创建、更新和销毁事件作为日志记录 | 对事件 API 的轮询器,或 webhook 接收器 |
| E2B OTel 遥测导出 | e2b.* 指标和 service_name: e2b 日志,完全无需编写代码 |
企业版套餐及入职申请 |
先来看第一条路径。它涵盖应用创建的所有 sandbox,包括由模型编写代码的那些。SDK 自身也会上报部分 HTTP 遥测数据,无需编写代码或引入 instrumentation 包,具体见SDK 自身上报的内容。其余功能位于可选配置中。这五个方案均基于OpenTelemetry,并导出到同一个 SigNoz 端点。
E2B sandbox 默认具备出站互联网访问权限,因此 exporter 在连接 SigNoz 前无需配置防火墙规则。如果你设置了 allow_internet_access=False 或 network 拒绝规则,请先阅读sandbox 无法连接 SigNoz。
从应用中监控 E2B Sandbox
此路径展示了每个 sandbox 的操作细节:运行了哪些执行任务、每个任务耗时多久、如何退出以及在哪里出错。
第一步:安装依赖包
Copypip install e2b-code-interpreter opentelemetry-sdk opentelemetry-exporter-otlp-proto-httpe2b-code-interpreter 封装了基础的 e2b SDK 并增加了 run_code 方法。如果你的 agent 只运行 shell 命令,请安装 e2b,移除下方的 traced_run_code 辅助函数,并从 e2b 而非 e2b_code_interpreter 中导入 Sandbox。由于 e2b 包不包含 e2b_code_interpreter 模块,否则导入将失败。
第二步:配置 OpenTelemetry SDK
将标准 OpenTelemetry 变量指向 SigNoz。exporter 会读取全部三个变量,因此代码中无需显式指定端点。
Copyexport E2B_API_KEY="<your-e2b-api-key>"
export OTEL_SERVICE_NAME="<your-service-name>"
export OTEL_EXPORTER_OTLP_ENDPOINT="https://ingest.<region>.signoz.cloud:443"
export OTEL_EXPORTER_OTLP_HEADERS="signoz-ingestion-key=<your-ingestion-key>"请核实以下值:
<your-e2b-api-key>:在E2B 仪表盘 > 密钥下创建。<your-service-name>:即应用在 SigNoz 中显示的名称,也是你在验证章节中进行过滤的依据。<region>:你的 SigNoz Cloud 区域。<your-ingestion-key>:你的 SigNoz ingestion key。
在启动时创建一次 provider:
telemetry.pyimport atexit
from opentelemetry import trace
from opentelemetry.exporter.otlp.proto.http.trace_exporter import OTLPSpanExporter
from opentelemetry.sdk.resources import Resource
from opentelemetry.sdk.trace import TracerProvider
from opentelemetry.sdk.trace.export import BatchSpanProcessor
# 这里不需要设置 service.name。Resource.create() 会运行环境探测器,
# 自动读取上面导出的 OTEL_SERVICE_NAME。
tracer_provider = TracerProvider(resource=Resource.create())
tracer_provider.add_span_processor(BatchSpanProcessor(OTLPSpanExporter()))
trace.set_tracer_provider(tracer_provider)
# 编排器通常生命周期很短。未刷出的批次会随进程一起消亡。
atexit.register(tracer_provider.shutdown)
tracer = trace.get_tracer("e2b-orchestrator")exporter 默认通过上面的 endpoint 使用基于 HTTP 的 OTLP。不要设置 OTEL_EXPORTER_OTLP_PROTOCOL=grpc,因为这个包只安装了 HTTP exporter。
第 3 步:添加带追踪的 sandbox 辅助函数
pyqwest 已经能记录 SDK 发出的每次 HTTP 调用的耗时,但它无法知道这次调用属于哪个 sandbox、代码是否抛出异常、命令的退出状态如何。这些辅助函数补上了这些信息,同时还会开启一个父 span,让 pyqwest 的 span 不再各自成为独立的 trace 根节点,而是嵌套在 session 之下。
OpenTelemetry 没有针对 sandbox 的语义约定,所以 e2b.* 是自定义命名空间。请保持各服务间的命名一致,这样仪表盘和告警才能持续正常工作。
traced_sandbox.py from contextlib import contextmanager

from e2b import CommandExitException
from e2b_code_interpreter import Sandbox
from opentelemetry.trace import Status, StatusCode

from telemetry import tracer


@contextmanager
def traced_sandbox(template=None, timeout=300, **kwargs):
    """创建沙箱,对其全生命周期进行追踪,并确保最终杀死它。"""
    with tracer.start_as_current_span("e2b sandbox session") as span:
        span.set_attribute("e2b.sandbox.timeout", timeout)
        if template:
            span.set_attribute("e2b.template.id", template)

        sandbox = Sandbox.create(template=template, timeout=timeout, **kwargs)
        span.set_attribute("e2b.sandbox.id", sandbox.sandbox_id)
        try:
            yield sandbox
        finally:
            sandbox.kill()


def traced_run_code(sandbox, code, **kwargs):
    """在沙箱中运行代码,并记录其执行结果。"""
    with tracer.start_as_current_span("e2b run_code") as span:
        span.set_attribute("e2b.sandbox.id", sandbox.sandbox_id)
        span.set_attribute("e2b.execution.code_bytes", len(code.encode()))

        execution = sandbox.run_code(code, **kwargs)

        span.set_attribute("e2b.execution.results", len(execution.results))
        if execution.error:
            span.set_attribute("e2b.execution.error.name", execution.error.name)
            span.set_attribute("e2b.execution.error.value", execution.error.value)
            span.set_status(Status(StatusCode.ERROR, execution.error.name))
        return execution


def traced_command(sandbox, cmd, **kwargs):
    """在沙箱中运行 shell 命令,并记录其退出码。"""
    with tracer.start_as_current_span("e2b commands.run") as span:
        span.set_attribute("e2b.sandbox.id", sandbox.sandbox_id)
        span.set_attribute("e2b.command", cmd)
        try:
            result = sandbox.commands.run(cmd, **kwargs)
        except CommandExitException as exc:
            # commands.run 会在退出码非零时抛出异常。该异常也是 CommandResult 的实例,
            # 因此携带退出码和输出。start_as_current_span 在退出时记录异常并设置错误状态,
            # 因此这里只需记录退出码。
            span.set_attribute("e2b.command.exit_code", exc.exit_code)
            raise

        span.set_attribute("e2b.command.exit_code", result.exit_code)
        return result
两个辅助函数对失败的处理方式不同,因为 SDK 本身就不同。当代码抛出异常时,`run_code` 会返回一个 `error` 字段被设置的 `Execution` 对象,因此辅助函数只需读取 `execution.error` 而不会捕获到异常。相反,`commands.run` 在任何非零退出码下会直接抛出 `CommandExitException` 而不是返回,所以辅助函数必须捕获该异常、记录退出码并重新抛出。这意味着在 `commands.run` 之后检查 `result.exit_code != 0` 的代码永远不会被执行。
`finally` 块至关重要。如果沙箱未被销毁,它会一直运行直到超时,而 E2B 会按整个存续时间计费。
不要将 `execution.logs.stdout` 或命令输出直接作为 span 的属性。输出是无界的,span 属性不适合存放这类数据。Trace the Code Inside a Sandbox 章节将其作为日志记录(log records)来发送。
步骤 4:运行你的编排器
run_agent.pyfrom traced_sandbox import traced_command, traced_run_code, traced_sandbox
with traced_sandbox(timeout=120) as sandbox:
execution = traced_run_code(sandbox, "print(sum(i * i for i in range(200000)))")
print(execution.logs.stdout)
result = traced_command(sandbox, "pip install --quiet pandas")
print(result.exit_code)
failing = traced_run_code(sandbox, "1 / 0")
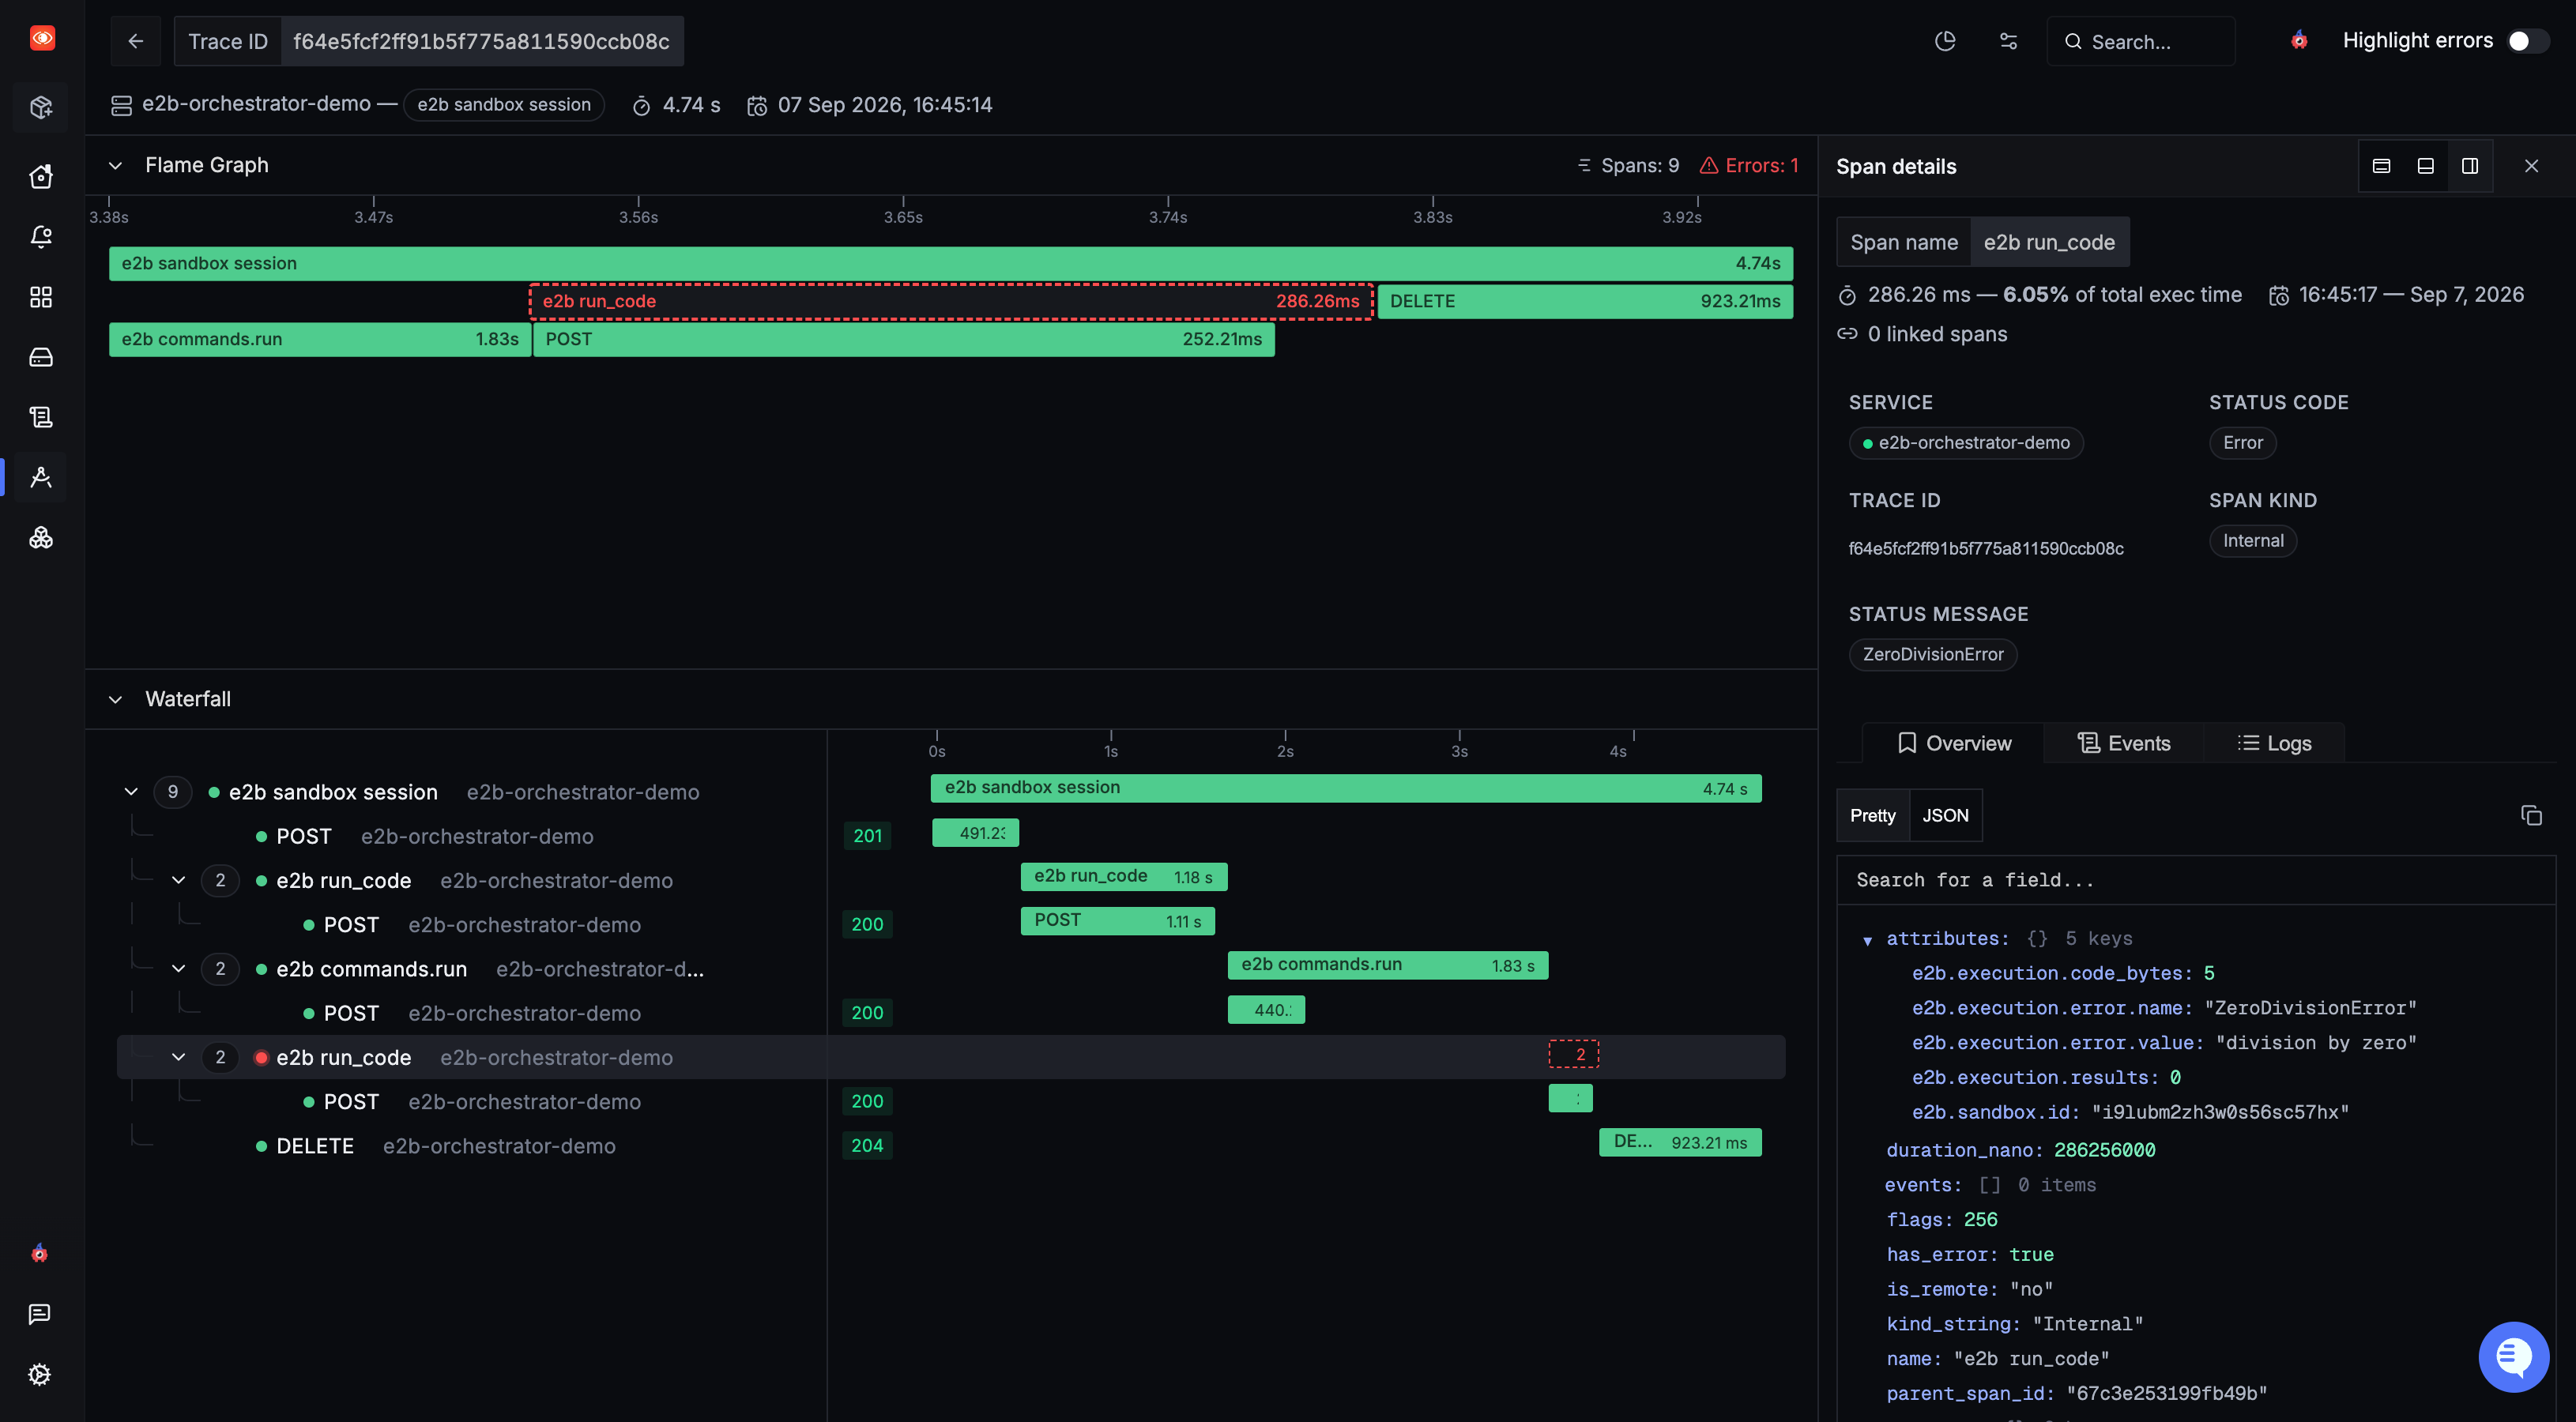
print(failing.error.name)python run_agent.py每个沙箱会生成一条 trace,其中 session span 为根,每次执行对应一个子 span。最后一次执行故意除以零,以便你查看的第一条 trace 中包含一个 error span。
验证
首次运行后等待一分钟,然后检查各项指标。
Traces: 打开 Traces explorer,过滤条件设为 service.name = '<your-service-name>'。查找 e2b sandbox session 根 span。
Errors: 在同一视图中过滤 status.code = 'Error'。针对 1 / 0 的 e2b run_code span 会带有 e2b.execution.error.name = 'ZeroDivisionError' 属性。
单沙箱: 过滤 e2b.sandbox.id 以隔离来自单个沙箱的所有 span。
每条 trace 里还有两个并非你创建的 client span,名为 POST 和 DELETE。它们来自 pyqwest,具体说明见 What the SDK Emits on Its Own 一节。